105 lines
12 KiB
XML
105 lines
12 KiB
XML



|
<?xml version="1.0" encoding="UTF-8" standalone="no"?>
|
|||
|
|
<svg xmlns="http://www.w3.org/2000/svg" viewBox="0 0 820 560" font-family="Arial, sans-serif" font-size="13"
|
|||
|
|
content="<mxfile host="app.diagrams.net" agent="Claude Code placeholder" version="22.0.0"> <diagram id="levelbasedMode" name="Level-based mode"> <mxGraphModel dx="1000" dy="700" grid="1" gridSize="10" pageWidth="820" pageHeight="560"> <root> <mxCell id="0"/> <mxCell id="1" parent="0"/> <mxCell id="title" value="Level-based mode — demand as a function of basin level" style="text;html=1;fontSize=16;fontStyle=1;align=center;" vertex="1" parent="1"> <mxGeometry x="60" y="20" width="700" height="24" as="geometry"/> </mxCell> <mxCell id="subtitle" value="Thresholds are static (from config); safety trips are handled by the mode-independent safety layer" style="text;html=1;fontSize=11;fontStyle=2;align=center;" vertex="1" parent="1"> <mxGeometry x="60" y="46" width="700" height="18" as="geometry"/> </mxCell> <mxCell id="plot_area" value="" style="rounded=0;whiteSpace=wrap;html=1;fillColor=#FAFAFA;strokeColor=#555555;strokeWidth=1;" vertex="1" parent="1"> <mxGeometry x="140" y="100" width="560" height="340" as="geometry"/> </mxCell> <mxCell id="stop_zone" value="STOP" style="rounded=0;whiteSpace=wrap;html=1;fillColor=#FADBD8;strokeColor=none;fontSize=12;fontStyle=1;verticalAlign=top;" vertex="1" parent="1"> <mxGeometry x="140" y="100" width="90" height="340" as="geometry"/> </mxCell> <mxCell id="dead_zone" value="DEAD ZONE" style="rounded=0;whiteSpace=wrap;html=1;fillColor=#FEF9E7;strokeColor=none;fontSize=12;fontStyle=1;verticalAlign=top;" vertex="1" parent="1"> <mxGeometry x="230" y="100" width="140" height="340" as="geometry"/> </mxCell> <mxCell id="ramp_zone" value="RAMP" style="rounded=0;whiteSpace=wrap;html=1;fillColor=#EAFAF1;strokeColor=none;fontSize=12;fontStyle=1;verticalAlign=top;" vertex="1" parent="1"> <mxGeometry x="370" y="100" width="190" height="340" as="geometry"/> </mxCell> <mxCell id="saturate_zone" value="SATURATE" style="rounded=0;whiteSpace=wrap;html=1;fillColor=#D5F5E3;strokeColor=none;fontSize=12;fontStyle=1;verticalAlign=top;" vertex="1" parent="1"> <mxGeometry x="560" y="100" width="140" height="340" as="geometry"/> </mxCell> <mxCell id="curve_stop" value="demand = 0" style="endArrow=none;html=1;strokeColor=#C0392B;strokeWidth=3;fontSize=11;verticalAlign=top;" edge="1" parent="1"> <mxGeometry relative="1" as="geometry"> <mxPoint x="140" y="440" as="sourcePoint"/> <mxPoint x="230" y="440" as="targetPoint"/> </mxGeometry> </mxCell> <mxCell id="curve_dead" value="demand = last cmd" style="endArrow=none;html=1;strokeColor=#E67E
|
|||
|
|
<title>Level-based mode — demand as a function of basin level</title>
|
|||
|
|
|
|||
|
|
<!-- Title -->
|
|||
|
|
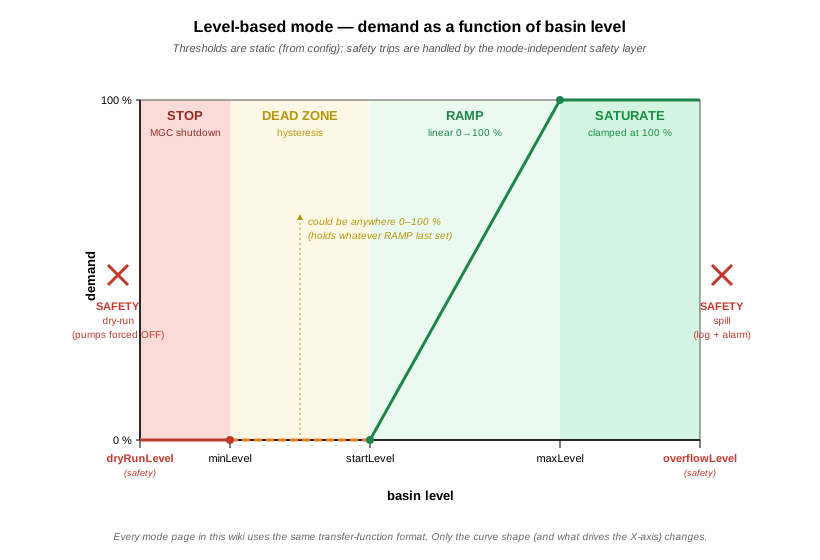
<text x="410" y="32" text-anchor="middle" font-weight="bold" font-size="16">Level-based mode — demand as a function of basin level</text>
|
|||
|
|
<text x="410" y="52" text-anchor="middle" font-size="11" font-style="italic" fill="#555">Thresholds are static (from config); safety trips are handled by the mode-independent safety layer</text>
|
|||
|
|
|
|||
|
|
<!-- Plot area background (zones) -->
|
|||
|
|
<rect x="140" y="100" width="90" height="340" fill="#FADBD8" />
|
|||
|
|
<rect x="230" y="100" width="140" height="340" fill="#FEF9E7" />
|
|||
|
|
<rect x="370" y="100" width="190" height="340" fill="#EAFAF1" />
|
|||
|
|
<rect x="560" y="100" width="140" height="340" fill="#D5F5E3" />
|
|||
|
|
|
|||
|
|
<!-- Plot outline -->
|
|||
|
|
<rect x="140" y="100" width="560" height="340" fill="none" stroke="#555" stroke-width="1" />
|
|||
|
|
|
|||
|
|
<!-- Zone labels -->
|
|||
|
|
<text x="185" y="120" text-anchor="middle" font-weight="bold" font-size="13" fill="#922B21">STOP</text>
|
|||
|
|
<text x="185" y="136" text-anchor="middle" font-size="10" fill="#922B21">MGC shutdown</text>
|
|||
|
|
<text x="300" y="120" text-anchor="middle" font-weight="bold" font-size="13" fill="#B7950B">DEAD ZONE</text>
|
|||
|
|
<text x="300" y="136" text-anchor="middle" font-size="10" fill="#B7950B">hysteresis</text>
|
|||
|
|
<text x="465" y="120" text-anchor="middle" font-weight="bold" font-size="13" fill="#1E8449">RAMP</text>
|
|||
|
|
<text x="465" y="136" text-anchor="middle" font-size="10" fill="#1E8449">linear 0→100 %</text>
|
|||
|
|
<text x="630" y="120" text-anchor="middle" font-weight="bold" font-size="13" fill="#148F3D">SATURATE</text>
|
|||
|
|
<text x="630" y="136" text-anchor="middle" font-size="10" fill="#148F3D">clamped at 100 %</text>
|
|||
|
|
|
|||
|
|
<!-- Y axis -->
|
|||
|
|
<line x1="140" y1="100" x2="140" y2="440" stroke="#000" stroke-width="1.5" />
|
|||
|
|
<text x="132" y="104" text-anchor="end" font-size="11">100 %</text>
|
|||
|
|
<text x="132" y="444" text-anchor="end" font-size="11">0 %</text>
|
|||
|
|
<line x1="136" y1="100" x2="140" y2="100" stroke="#000" stroke-width="1" />
|
|||
|
|
<line x1="136" y1="440" x2="140" y2="440" stroke="#000" stroke-width="1" />
|
|||
|
|
<text x="95" y="276" text-anchor="middle" font-weight="bold" transform="rotate(-90 95 276)">demand</text>
|
|||
|
|
|
|||
|
|
<!-- X axis -->
|
|||
|
|
<line x1="140" y1="440" x2="700" y2="440" stroke="#000" stroke-width="1.5" />
|
|||
|
|
<!-- Ticks + labels for each threshold -->
|
|||
|
|
<g font-size="11" text-anchor="middle">
|
|||
|
|
<line x1="140" y1="440" x2="140" y2="448" stroke="#000" />
|
|||
|
|
<text x="140" y="462" fill="#C0392B" font-weight="bold">dryRunLevel</text>
|
|||
|
|
<text x="140" y="476" fill="#C0392B" font-size="9" font-style="italic">(safety)</text>
|
|||
|
|
|
|||
|
|
<line x1="230" y1="440" x2="230" y2="448" stroke="#000" />
|
|||
|
|
<text x="230" y="462">minLevel</text>
|
|||
|
|
|
|||
|
|
<line x1="370" y1="440" x2="370" y2="448" stroke="#000" />
|
|||
|
|
<text x="370" y="462">startLevel</text>
|
|||
|
|
|
|||
|
|
<line x1="560" y1="440" x2="560" y2="448" stroke="#000" />
|
|||
|
|
<text x="560" y="462">maxLevel</text>
|
|||
|
|
|
|||
|
|
<line x1="700" y1="440" x2="700" y2="448" stroke="#000" />
|
|||
|
|
<text x="700" y="462" fill="#C0392B" font-weight="bold">overflowLevel</text>
|
|||
|
|
<text x="700" y="476" fill="#C0392B" font-size="9" font-style="italic">(safety)</text>
|
|||
|
|
</g>
|
|||
|
|
<text x="420" y="500" text-anchor="middle" font-weight="bold">basin level</text>
|
|||
|
|
|
|||
|
|
<!-- Transfer function curve -->
|
|||
|
|
<!-- STOP segment: y=440 (demand=0) -->
|
|||
|
|
<line x1="140" y1="440" x2="230" y2="440" stroke="#C0392B" stroke-width="3" />
|
|||
|
|
<!-- DEAD ZONE segment: dashed to signal "hold" -->
|
|||
|
|
<line x1="230" y1="440" x2="370" y2="440" stroke="#E67E22" stroke-width="3" stroke-dasharray="8 4" />
|
|||
|
|
<!-- RAMP: diagonal -->
|
|||
|
|
<line x1="370" y1="440" x2="560" y2="100" stroke="#1E8449" stroke-width="3" />
|
|||
|
|
<!-- SATURATE: y=100 (demand=100) -->
|
|||
|
|
<line x1="560" y1="100" x2="700" y2="100" stroke="#1E8449" stroke-width="3" />
|
|||
|
|
|
|||
|
|
<!-- Endpoint dots -->
|
|||
|
|
<circle cx="230" cy="440" r="4" fill="#C0392B" />
|
|||
|
|
<circle cx="370" cy="440" r="4" fill="#1E8449" />
|
|||
|
|
<circle cx="560" cy="100" r="4" fill="#1E8449" />
|
|||
|
|
|
|||
|
|
<!-- Curve annotation for dead-zone semantics (important — the DEAD ZONE is not really "0") -->
|
|||
|
|
<g>
|
|||
|
|
<line x1="300" y1="440" x2="300" y2="220" stroke="#B7950B" stroke-width="1" stroke-dasharray="2 3" />
|
|||
|
|
<polygon points="297,220 303,220 300,214" fill="#B7950B" />
|
|||
|
|
<text x="308" y="225" font-size="10" fill="#B7950B" font-style="italic">could be anywhere 0–100 %</text>
|
|||
|
|
<text x="308" y="239" font-size="10" fill="#B7950B" font-style="italic">(holds whatever RAMP last set)</text>
|
|||
|
|
</g>
|
|||
|
|
|
|||
|
|
<!-- Safety trip markers — outside the plot to emphasize "never-should-happen" -->
|
|||
|
|
<g>
|
|||
|
|
<!-- Left: dry-run -->
|
|||
|
|
<line x1="108" y1="265" x2="128" y2="285" stroke="#C0392B" stroke-width="3" />
|
|||
|
|
<line x1="128" y1="265" x2="108" y2="285" stroke="#C0392B" stroke-width="3" />
|
|||
|
|
<text x="118" y="310" text-anchor="middle" font-size="11" font-weight="bold" fill="#C0392B">SAFETY</text>
|
|||
|
|
<text x="118" y="324" text-anchor="middle" font-size="10" fill="#C0392B">dry-run</text>
|
|||
|
|
<text x="118" y="338" text-anchor="middle" font-size="10" fill="#C0392B">(pumps forced OFF)</text>
|
|||
|
|
|
|||
|
|
<!-- Right: overflow -->
|
|||
|
|
<line x1="712" y1="265" x2="732" y2="285" stroke="#C0392B" stroke-width="3" />
|
|||
|
|
<line x1="732" y1="265" x2="712" y2="285" stroke="#C0392B" stroke-width="3" />
|
|||
|
|
<text x="722" y="310" text-anchor="middle" font-size="11" font-weight="bold" fill="#C0392B">SAFETY</text>
|
|||
|
|
<text x="722" y="324" text-anchor="middle" font-size="10" fill="#C0392B">spill</text>
|
|||
|
|
<text x="722" y="338" text-anchor="middle" font-size="10" fill="#C0392B">(log + alarm)</text>
|
|||
|
|
</g>
|
|||
|
|
|
|||
|
|
<!-- Footer note -->
|
|||
|
|
<text x="410" y="540" text-anchor="middle" font-size="10" font-style="italic" fill="#666">
|
|||
|
|
Every mode page in this wiki uses the same transfer-function format. Only the curve shape (and what drives the X-axis) changes.
|
|||
|
|
</text>
|
|||
|
|
</svg>
|